Golden Swap (Zeiierman)█ Overview
The Golden Swap indicator, as designed by Zeiierman, focuses on identifying reversal points around the key levels indicated by the indicator. This pattern works by analyzing the relationship between current and past price movements, considering factors like price symmetry, baseline boundaries, and precision pin bar formations. It can offer insights into potential market reversals, allowing for more precise entries and exits.
█ How It Works
Golden Swap Long
In a market with bullish momentum, we expect the price to dip a bit before it continues to rise again. This dip is like a small retreat in an overall march upwards. So, the pattern aims to assess whether the current period's dip is relatively shallow, indicating that the overall bullish momentum remains robust despite temporary price fluctuations.
Golden Swap Short
In a market with bearish momentum (indicating selling pressure or bearish sentiment), we may still see the price rise a bit before continuing its drop. This temporary rise is like a slight bounce in an overall downward movement. In simpler terms, even when the price bounces up a bit, it's not strong enough to overcome the recent pressure of selling. The sellers are still dominating, and the price will likely continue to drop.
█ The signal is reinforced by symmetry, BaselineBound criteria, and a bearish Precision PinBar.
⚪ Symmetry in Price Movements: The pattern uses the Symmetry Precision filter to analyze the symmetry of recent price movements. This helps in determining the likelihood of a reversal. A high degree of symmetry suggests a more reliable reversal signal.
⚪ BaselineBound Criteria: This component involves the BaselineBound Threshold, which acts as a filter to validate the strength of the potential reversal. Bullish and bearish conditions are assessed based on how the current close price compares to a calculated range around the high and low of the previous period.
⚪ Precision PinBar Analysis: The pattern also incorporates the Precision PinBar filter, which evaluates the characteristics of the recent price bars. A Precision PinBar is a candlestick with a small body and a long tail, indicating a potential reversal.
⚪ Display of Key Levels: The indicator can show Open, High, and Low levels for selected timeframes, helping traders identify key price points.
█ How to Use
The Golden Swap pattern is a valuable confirmation tool, particularly around key levels or session highs and lows. It highlights instances where a previous high or low has been respected, followed by a price reversal—flipping back up in an upward trend (Golden Swap Long) or flipping back down in a downward trend (Golden Swap Short). When this pattern emerges near a key level, it strongly suggests that the price will continue moving in the direction indicated by the current trend.
Consider it akin to a minor liquidity hunt above the previous high or below the previous low. The presence of the Golden Swap pattern, especially when aligned with other indicators and filters, enhances its reliability as a signal for the continuation of the prevailing market trend.
█ Settings
Timeframe Selection: Choose from various timeframes for signal calculation.
Filter Adjustments: Fine-tune the Symmetry Precision, BaselineBound Threshold, and Precision PinBar settings to filter signals according to specific criteria.
Display Options for Key Levels: Enable or disable the display of key price levels and select timeframes for these levels.
█ Related script using the same pattern filtering techniques
-----------------
Disclaimer
The information contained in my Scripts/Indicators/Ideas/Algos/Systems does not constitute financial advice or a solicitation to buy or sell any securities of any type. I will not accept liability for any loss or damage, including without limitation any loss of profit, which may arise directly or indirectly from the use of or reliance on such information.
All investments involve risk, and the past performance of a security, industry, sector, market, financial product, trading strategy, backtest, or individual's trading does not guarantee future results or returns. Investors are fully responsible for any investment decisions they make. Such decisions should be based solely on an evaluation of their financial circumstances, investment objectives, risk tolerance, and liquidity needs.
My Scripts/Indicators/Ideas/Algos/Systems are only for educational purposes!
Tìm kiếm tập lệnh với "key levels"

Linear Regression Market State IndexStandard Deviation Market Structure Indicator
A Comprehensive Multi-Timeframe Market Analysis Tool
🎯 Overview
The Standard Deviation Market Structure (SDMS) indicator is a sophisticated technical analysis tool that integrates multiple proven methodologies to identify market structure, trend direction, and potential reversal zones. By combining price action, statistical analysis, and momentum indicators across multiple timeframes, SDMS provides traders with a comprehensive view of market dynamics.
✨ Key Features
Multi-Timeframe Integration
Primary analysis on current timeframe
1-hour statistical confirmation for support/resistance levels
Order block extension across 500 future bars
Comprehensive Technical Suite
RSI with Deviation Analysis
Dynamic Order Block Detection
Gaussian Filter Channels
Linear Regression with Statistical Bands
Standard deviation to detect price outliers
Directional Movement Index (DMI/ADX)
Bollinger Band % Analysis
Support/Resistance Line System
Visual Clarity
Color-coded signals and zones
Automatic level management
Clean, intuitive display
📊 Core Components Explained
1. Order Block System
What Are Order Blocks?
Order blocks are price zones where institutional activity has occurred, creating future support or resistance levels. SDMS automatically detects these critical zones.
Detection Logic:
Bullish Order Blocks: Form when price breaks above recent highs following bearish candles
Bearish Order Blocks: Form when price breaks below recent lows following bullish candles
Visual Identification:
Green boxes with "BuOB" labels (support zones)
Red boxes with "BeOB" labels (resistance zones)
Each block shows its boundary price for easy reference
Dynamic Management:
Automatically extends 300 bars into the future
Self-cleaning: removes blocks when price breaches their boundaries
Real-time adjustment to changing market structure
2. Statistical Support/Resistance System
How It Works:
SDMS creates support and resistance lines based on statistical extremes confirmed on the 1-hour timeframe.
Trigger Conditions:
Support Lines (Green): Trigger when 1H Bollinger Band % crosses above 0 and bearish momentum subsides.
Resistance Lines (Red): Trigger when 1H Bollinger Band % crosses below 1 and bullish momentum subsides
The Science Behind BB%:
BB% = (Price - Lower Band) / (Upper Band - Lower Band)
BB% <= 0: Price at statistical oversold extreme; also indicated by white candles.
BB% > 1: Price at statistical overbought extreme; also indicated by white candles.
Line Management:
Maximum of 15 active lines
Oldest lines automatically removed
Lines extend across chart for ongoing reference
3. Trend Analysis Suite
Hull Moving Average (HMA):
55-period smoothed trend indicator
Color-coded: Green = bullish, Red = bearish
Visual band shows trend acceleration/deceleration
Gaussian Channel:
Advanced filtering of market noise
Dynamic channel based on true range volatility
Helps identify mean reversion opportunities
Form a yellow band when price is overbought or oversold zones.
Linear Regression System:
Statistical price modeling
Multiple standard deviation bands (up to 3SD)
Regression-based candlestick visualization
Candles turn white when in overbought zones. Yellow candles indicate extremely overbought zones. Blue candles indicate a bullish trend with high volume.
Bearish candles are bluish-purple when volume is high and red when the volume is within normal ranges or low.
4. Momentum & Oscillator Integration
RSI with Deviation Tracking:
21-period RSI with 30-period smoothing
Tracks deviation from moving average based off linear regression
Identifies momentum divergences
Directional Movement Index:
Multi-period DMI/ADX analysis
Used to detect overbought and oversold zones within the indicator calculations.
Combines with RSI for enhanced signals
Momentum confirmation for all entries/exits
🎯 Trading Signals & Alerts
Buy Signals (Yellow "Buy" Labels)
Multi-Condition Confirmation Required:
RSI Oversold Reversal: RSI crosses above 30
Trend Alignment: HMA showing bullish structure
Momentum Confirmation: DMI alignment
Statistical Support: Price at or near support zones
Risk Management: Multiple confirming indicators
Strong Buy Conditions:
Confluence of order block support + BB% support line
Multiple timeframe alignment
Volume confirmation at key levels
Sell Signals (Red/Yellow "Sell" Labels)
Multi-Condition Confirmation Required:
RSI Overbought Reversal: RSI crosses below 70
Trend Exhaustion: HMA showing bearish structure
Momentum Divergence: DMI bearish alignment
Statistical Resistance: Price at or near resistance zones
Timeframe Confirmation: 1H BB% bearish signals
Strong Sell Conditions:
Confluence of order block resistance + BB% resistance line
Multiple timeframe distribution
Volume surge at resistance
Additional Alerts
RSI Divergence Signals: Triangles showing momentum shifts
Extreme Price Alerts: Circles at statistical extremes
Structure Breaks: Visual cues for order block violations
🎨 Visual System Guide
Color Coding System
Green: Bullish conditions, support zones, rising trends
Red: Bearish conditions, resistance zones, falling trends
Blue: Statistical channels, neutral zones
Yellow: Alert conditions, extreme signals
White: Transition zones, neutral signals
Zone Identification
Buying Pressure Zones: Green/blue tinted areas below price or white candles with white dots within the moving average center line
Selling Pressure Zones: Red tinted areas above price with white dots within the moving average center line
Standard Deviation Zones: Gradient colors showing statistical extremes
⚙️ Customization Options
Adjustable Parameters
RSI Settings: Period, oversold/overbought levels, sensitivity
Order Block Detection: Lookback period, ATR multiplier, extension
Statistical Settings: Gaussian filter poles, regression periods
Support/Resistance: Maximum lines, BB% settings
Visual Preferences: Colors, band displays, alert styles
Input Groups
RSI Trading Strategy
Order Block Configuration
Gaussian Channel Settings
Linear Regression Parameters
DMI/ADX Configuration
Bollinger Band % Settings
📈 Practical Trading Applications
For Swing Traders
Identify Key Levels: Use order blocks + BB% lines for entry/exit planning
Trend Confirmation: HMA + Gaussian channel for trend direction
Risk Management: Standard deviation bands for stop placement
Timing Entries: RSI/DMI alignment for optimal entry timing
For Day Traders
Intraday Levels: Order blocks provide immediate S/R for day trading
Momentum Signals: Real-time RSI/DMI signals for quick moves
Statistical Edges: Gaussian channel for mean reversion plays
Breakout Confirmation: Order block breaks with volume
For Position Traders
Higher Timeframe Structure: 1H BB% lines for major levels
Trend Persistence: HMA for long-term trend identification
Accumulation/Distribution Zones: Order blocks show institutional activity
Multi-Timeframe Alignment: Confirmation across timeframes
🔍 How to Use SDMS Effectively
Step 1: Market Structure Assessment
Identify active order blocks (green/red boxes)
Note BB% support/resistance lines (horizontal lines)
Assess HMA and moving average trend direction (color)
Check Gaussian channel position (preferably outside 2SD)
Step 2: Signal Confirmation
Wait for multiple indicator alignment
look for doji candles.
Confirm with green (bullish) or red (bearish) candles
Confirm with volume if available
Check for confluence of levels
Assess risk/reward based on nearby levels
Step 3: Trade Management
Enter at confirmed support/resistance
Place stops beyond opposite levels
Take profits at next statistical level
Monitor for structure changes
Step 4: Risk Management
Use standard deviation bands for volatility assessment
Never risk more than 1-2% per trade
Adjust position size based on confluence strength
Have predefined exit rules
💡 Advanced Strategies
Strategy 1: Confluence Trading
Setup: Order block + BB% line at same level
Entry: Price tests confluence zone with RSI signal
Stop: Beyond the confluence zone
Target: Next statistical level
Strategy 2: Breakout Trading
Setup: Price approaching order block boundary
Entry: Break with volume + RSI/DMI confirmation
Stop: Re-entry into order block
Target: Next BB% line extension
Strategy 3: Mean Reversion
Setup: Price at Gaussian channel extremes
Entry: RSI reversal signal at channel boundary
Stop: Beyond channel extreme
Target: Channel midline or opposite boundary
⚠️ Important Considerations
Best Market Conditions
Trending Markets: Excellent performance in clear trends
Breakout Scenarios: Strong identification of break levels
Range Markets: Works well with defined ranges
Limitations
Choppy Markets: May give false signals in consolidation
News Events: Fundamental shocks can override technical levels
Timeframe Specific: Optimal on 15-minute to daily charts
Risk Management Rules
Always use stops
Never rely on single signals
Consider market context
Adjust for volatility changes
Keep position sizes consistent
🔧 Technical Specifications
Maximum Lines: 500
Maximum Bars Back: 1000
Maximum Boxes: 500
Calculation Efficiency: Optimized for real-time use
🏆 Why SDMS Stands Out
Unique Advantages
Integrated Approach: Combines multiple methodologies into one tool
Self-Adjusting: Automatically adapts to market changes
Multi-Timeframe: Provides both immediate and higher timeframe context
Visual Clarity: Clean, intuitive display of complex data
Professional Grade: Institutional-level analysis accessible to all traders
Educational Value: Learn how different indicators interact
Understand market structure development
See institutional order flow patterns
Develop disciplined trading habits
📚 Learning Resources
Recommended Study Approach
Start Simple: Focus on order blocks and BB% lines first
Add Complexity: Gradually incorporate other indicators
Paper Trade: Practice without risk
Keep Journal: Document setups and outcomes
Review Regularly: Analyze both wins and losses
Common Pitfalls to Avoid
Overtrading: Wait for high-quality setups
Ignoring Context: Consider overall market conditions
Chasing Signals: Enter at planned levels, not after moves
Risk Mismanagement: Always know your risk before entering
Confirmation Bias: Be objective about signals
🤝 Community & Support
Getting the Most from SDMS
Start with Defaults: Use default settings initially
Adjust Gradually: Make small changes as you understand the tool
Combine with Fundamentals: Use for timing within fundamental context
Stay Disciplined: Follow your trading plan consistently
Continuous Improvement
SDMS is designed for continuous learning. As you use the indicator, you'll develop insights into:
Market microstructure
Institutional trading patterns
Statistical edge identification
Risk management optimization
Risk management is more important than signal accuracy
Patience is required for high-quality setups
Success Factors
Discipline: Following your plan consistently
Patience: Waiting for proper setups
Risk Management: Protecting your capital
Continuous Learning: Improving your skills over time
🌟 Final Thoughts
The Standard Deviation Market Structure indicator represents a sophisticated approach to technical analysis, combining the best elements of price action, statistical analysis, and momentum indicators. While powerful, remember that no indicator guarantees success. SDMS is a tool – your skill, discipline, and risk management determine your trading results.
Use SDMS as part of a comprehensive trading plan, combine it with proper risk management, and continue developing your trading skills. The markets are always teaching – stay humble, stay disciplined, and trade well.
Disclaimer: This indicator is for educational purposes only. Past performance does not guarantee future results. Trading involves risk of loss. Always consult with a qualified financial professional before making investment decisions.

ICT Anchored Market Structures with Validation [LuxAlgo]The ICT Anchored Market Structures with Validation indicator is an advanced iteration of the original Pure-Price-Action-Structures tool, designed for price action traders.
It systematically tracks and validates key price action structures, distinguishing between true structural shifts/breaks and short-term sweeps to enhance trend and reversal analysis. The indicator automatically highlights structural points, confirms breakouts, identifies sweeps, and provides clear visual cues for short-term, intermediate-term, and long-term market structures.
A distinctive feature of this indicator is its exclusive reliance on price patterns. It does not depend on any user-defined input, ensuring that its analysis remains robust, objective, and uninfluenced by user bias, making it an effective tool for understanding market dynamics.
🔶 USAGE
Market structure is a cornerstone of price action analysis. This script automatically detects real-time market structures across short-term, intermediate-term, and long-term levels, simplifying trend analysis for traders. It assists in identifying both trend reversals and continuations with greater clarity.
Market structure shifts and breaks help traders identify changes in trend direction. A shift signals a potential reversal, often occurring when a swing high or low is breached, suggesting a transition in trend. A break, on the other hand, confirms the continuation of an established trend, reinforcing the current direction. Recognizing these shifts and breaks allows traders to anticipate price movement with greater accuracy.
It’s important to note that while a CHoCH may signal a potential trend reversal and a BoS suggests a continuation of the prevailing trend, neither guarantees a complete reversal or continuation. In some cases, CHoCH and BoS levels may act as liquidity zones or areas of consolidation rather than indicating a clear shift or continuation in market direction. The indicator’s validation component helps confirm whether the detected CHoCH and BoS are true breakouts or merely liquidity sweeps.
🔶 DETAILS
🔹 Market Structures
Market structures are derived from price action analysis, focusing on identifying key levels and patterns in the market. Swing point detection, a fundamental concept in ICT trading methodologies and teachings, plays a central role in this approach.
Swing points are automatically identified based exclusively on market movements, without requiring any user-defined input.
🔹 Utilizing Swing Points
Swing points are not identified in real-time as they form. Short-term swing points may appear with a delay of up to one bar, while the identification of intermediate and long-term swing points is entirely dependent on subsequent market movements. Importantly, this detection process is not influenced by any user-defined input, relying solely on pure price action. As a result, swing points are generally not intended for real-time trading scenarios.
Instead, traders often analyze historical swing points to understand market trends and identify potential entry and exit opportunities. By examining swing highs and lows, traders can:
Recognize Trends: Swing highs and lows provide insight into trend direction. Higher swing highs and higher swing lows signify an uptrend, while lower swing highs and lower swing lows indicate a downtrend.
Identify Support and Resistance Levels: Swing highs often act as resistance levels, referred to as Buyside Liquidity Levels in ICT terminology, while swing lows function as support levels, also known as Sellside Liquidity Levels. Traders can leverage these levels to plan their trade entries and exits.
Spot Reversal Patterns: Swing points can form key reversal patterns, such as double tops or bottoms, head and shoulders, and triangles. Recognizing these patterns can indicate potential trend reversals, enabling traders to adjust their strategies effectively.
Set Stop Loss and Take Profit Levels: In ICT teachings, swing levels represent price points with expected clusters of buy or sell orders. Traders can target these liquidity levels/pools for position accumulation or distribution, using swing points to define stop loss and take profit levels in their trades.
Overall, swing points provide valuable information about market dynamics and can assist traders in making more informed trading decisions.
🔹 Logic of Validation
The validation process in this script determines whether a detected market structure shift or break represents a confirmed breakout or a sweep.
The breakout is confirmed when the close price is significantly outside the deviation range of the last detected structural price. This deviation range is defined by the 17-period Average True Range (ATR), which creates a buffer around the detected market structure shift or break.
A sweep occurs when the price breaches the structural level within the deviation range but does not confirm a breakout. In this case, the label is updated to 'SWEEP.'
A visual box is created to represent the price range where the breakout or sweep occurs. If the validation process continues, the box is updated. This box visually highlights the price range involved in a sweep, helping traders identify liquidity events on the chart.
🔶 SETTINGS
The settings for Short-Term, Intermediate-Term, and Long-Term Structures are organized into groups, allowing users to customize swing points, market structures, and visual styles for each.
🔹 Structures
Swings and Size: Enables or disables the display of swing highs and lows, assigns icons to represent the structures, and adjusts the size of the icons.
Market Structures: Toggles the visibility of market structure lines.
Market Structure Validation: Enable or disable validation to distinguish true breakouts from liquidity sweeps.
Market Structure Labels: Displays or hides labels indicating the type of market structure.
Line Style and Width: Allows customization of the style and width of the lines representing market structures.
Swing and Line Colors: Provides options to adjust the colors of swing icons, market structure lines, and labels for better visualization.
🔶 RELATED SCRIPTS
Pure-Price-Action-Structures.
Market-Structures-(Intrabar).

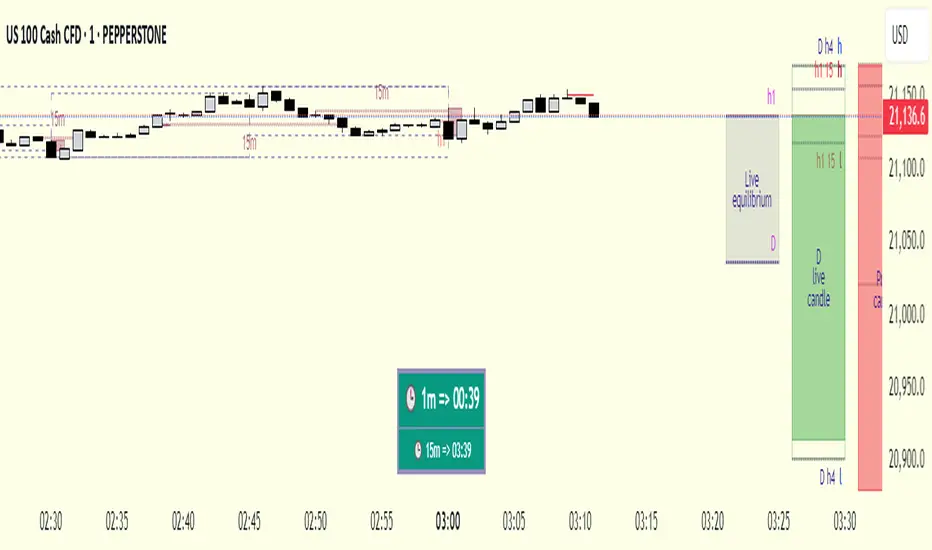
HTF OHLC Candle + 50% @MaxMaseratiHTF OHLC Candle + 50% @MaxMaserati
This advanced multi-timeframe indicator displays higher timeframe OHLC data as visual candle boxes and extended key levels on lower timeframe charts, providing essential context for institutional trading decisions.
Core Functionality:
Multi-Timeframe Box Display:
Main Timeframe Box (Default H4): Shows complete higher timeframe candles as colored boxes with separate body and wick visualization, including bullish (green) and bearish (red) candle representation with customizable transparency levels.
Independent Box 2 (Default M15): Secondary timeframe display with lime/fuchsia color scheme, allowing traders to monitor intermediate timeframes simultaneously with different visual styling.
Independent Box 3 (Default H1): Third independent timeframe with blue/orange color scheme, providing additional context for multi-timeframe analysis and confluence identification.
OHLC Level Analysis:
Each timeframe box includes individual Open, High, Low, and Close level lines with customizable colors and visibility settings. These levels act as key support and resistance zones that institutional traders often respect.
50% Retracement Levels:
Automatic calculation and display of 50% levels between each timeframe's high and low, representing critical equilibrium zones where price often finds support or resistance during retracements.
Extended Line System:
Current Live Timeframe Extended Lines: Real-time extension of the forming candle's Open, High, Low, and 50% levels with customizable line weights and label positioning.
TF2 Extended Lines (Default H4): Previous completed candle's key levels extended forward, showing immediate higher timeframe reference points for current price action.
TF3 Extended Lines (Default Daily): Longer-term reference levels from daily or weekly timeframes, providing macro trend context and major institutional levels.
Key Features:
Smart Timeframe Detection: Only displays boxes for timeframes higher than the current chart timeframe, preventing redundant information and maintaining chart clarity.
Global Box Limit Control: Intelligent cleanup system that maintains optimal performance by limiting total displayed elements while preserving the most recent and relevant timeframe periods.
Comprehensive Customization: Full control over colors, transparency, line weights, label sizes, and visibility for each timeframe component, allowing personalized setups for different trading styles.
Label System: Automatic timeframe identification labels (H4, M15, D1, etc.) positioned on each box for instant timeframe recognition and clear multi-timeframe organization.
Current Candle Options: Optional display of forming/current candles for each timeframe, enabling real-time monitoring of developing price action and potential setup completion.
This indicator is essential for traders utilizing multi-timeframe analysis, institutional trading concepts, and higher timeframe confluence strategies, providing clear visual representation of key levels and candle structures that drive major market movements.

Initial balance - weeklyWeekly Initial Balance (IB) — Indicator Description
The Weekly Initial Balance (IB) is the price range (High–Low) established during the week’s first trading session (most commonly Monday). You can measure it over the entire day or just the first X hours (e.g. 60 or 120 minutes). Once that session ends, the IB High and IB Low define the key levels where the initial weekly range formed.
Why Measure the Weekly IB?
Week-Opening Sentiment:
Monday’s range often sets the tone for the rest of the week. Trading above the IB High signals bullish control; trading below the IB Low signals bearish control.
Key Liquidity Zones:
Large institutions tend to place orders around these extremes, so you’ll frequently see tests, breakouts, or rejections at these levels.
Support & Resistance:
The IB High and IB Low become natural barriers. Price will often return to them, bounce off them, or break through them—ideal spots for entries and exits.
Volatility Forecast:
The width of the IB (High minus Low) indicates whether to expect a volatile week (wide IB) or a quieter one (narrow IB).
Significance of IB Levels
Breakout:
A clear break above the IB High (for longs) or below the IB Low (for shorts) can ignite a strong trending move.
Fade:
A rejection off the IB High/Low during low momentum (e.g. low volume or pin-bar formations) offers a high-probability reversal trade.
Mid-Point:
The 50% level of the IB range often “magnetizes” price back to it, providing entry points for continuation or reversal strategies.
Three Core Monday IB Strategies
A. Breakout (Open-Range Breakout)
Entry: Wait for 1–2 candles (e.g. 5-minute) to close above IB High (long) or below IB Low (short).
Stop-Loss: A few pips below IB High (long) or above IB Low (short).
Profit-Target: 2–3× your risk (Reward:Risk ≥ 2:1).
Best When: You spot a clear impulse—such as a strong pre-open volume spike or news-driven move.
B. Fade (Reversal at Extremes)
Entry: When price tests IB High but shows weakening momentum (shrinking volume, upper-wick candles), enter short; vice versa for IB Low and longs.
Stop-Loss: Just beyond the IB extreme you’re fading.
Profit-Target: Back toward the IB mid-point (50% level) or all the way to the opposite IB extreme.
Best When: Monday’s action is range-bound and lacks a clear directional trend.
C. Mid-Point Trading
Entry: When price returns to the 50% level of the IB range.
In an up-trend: buy if it bounces off mid-point back toward IB High.
In a down-trend: sell if it reverses off mid-point back toward IB Low.
Stop-Loss: Just below the nearest swing-low (for longs) or above the nearest swing-high (for shorts).
Profit-Target: To the corresponding IB extreme (High or Low).
Best When: You see a strong initial move away from the IB, followed by a pullback to the mid-point.
Usage Steps
Configure your session: Measure IB over your chosen Monday timeframe (whole day or first X hours).
Choose your strategy: Align Breakout, Fade, or Mid-Point entries with the current market context (trend vs. range).
Manage risk: Keep risk per trade ≤ 1% of account and maintain at least a 2:1 Reward:Risk ratio.
Backtest & forward-test: Verify performance over multiple Mondays and in a paper-trading environment before going live.

Timeframe Resistance Evaluation And Detection - CoffeeKillerTREAD - Timeframe Resistance Evaluation And Detection Guide
🔔 Important Technical Limitation 🔔
**This indicator does NOT fetch true higher timeframe data.** Instead, it simulates higher timeframe levels by aggregating data from your current chart timeframe. This means:
- Results will vary depending on what chart timeframe you're viewing
- Levels may not match actual higher timeframe candle highs/lows
- You might miss important wicks or gaps that occurred between chart timeframe bars
- **Always verify levels against actual higher timeframe charts before trading**
Welcome traders! This guide will walk you through the TREAD (Timeframe Resistance Evaluation And Detection) indicator, a multi-timeframe analysis tool developed by CoffeeKiller that identifies support and resistance confluence across different time periods.(I am 50+ year old trader and always thought I was bad a teaching and explaining so you get a AI guide. I personally use this on the 5 minute chart with the default settings, but to each there own and if you can improve the trend detection methods please DM me. I would like to see the code. Thanks)
Core Components
1. Dual Timeframe Level Tracking
- Short Timeframe Levels: Tracks opening price extremes within shorter periods
- Long Timeframe Levels: Tracks actual high/low extremes within longer periods
- Dynamic Reset Mechanism: Levels reset at the start of each new timeframe period
- Momentum Detection: Identifies when levels change mid-period, indicating active price movement
2. Visual Zone System
- High Zones: Areas between long timeframe highs and short timeframe highs
- Low Zones: Areas between long timeframe lows and short timeframe lows
- Fill Coloring: Dynamic colors based on whether levels are static or actively changing
- Momentum Highlighting: Special colors when levels break during active periods
3. Customizable Display Options
- Multiple Plot Styles: Line, circles, or cross markers
- Flexible Timeframe Selection: Wide range of short and long timeframe combinations
- Color Customization: Separate colors for each level type and momentum state
- Toggle Controls: Show/hide different elements based on trading preference
Main Features
Timeframe Settings
- Short Timeframe Options: 15m, 30m, 1h, 2h, 4h
- Long Timeframe Options: 1h, 2h, 4h, 8h, 12h, 1D, 1W
- Recommended Combinations:
- Scalping: 15m/1h or 30m/2h
- Day Trading: 30m/4h or 1h/4h
- Swing Trading: 4h/1D or 1D/1W
Display Configuration
- Level Visibility: Toggle short/long timeframe levels independently
- Fill Zone Control: Enable/disable colored zones between levels
- Momentum Fills: Special highlighting for actively changing levels
- Line Customization: Width, style, and color options for all elements
Color System
- Short TF High: Default red for resistance levels
- Short TF Low: Default green for support levels
- Long TF High: Transparent red for broader resistance context
- Long TF Low: Transparent green for broader support context
- Momentum Colors: Brighter colors when levels are actively changing
Technical Implementation Details
How Level Tracking Works
The indicator uses a custom tracking function that:
1. Detects Timeframe Periods: Uses `time()` function to identify when new periods begin
2. Tracks Extremes: Monitors highest/lowest values within each period
3. Resets on New Periods: Clears tracking when timeframe periods change
4. Updates Mid-Period: Continues tracking if new extremes are reached
The Timeframe Limitation Explained
`pinescript
// What the indicator does:
short_tf_start = ta.change(time(short_timeframe)) != 0 // Detects 30m period start
= track_highest(open, short_tf_start) // BUT uses chart TF opens!
// What true multi-timeframe would be:
// short_tf_high = request.security(syminfo.tickerid, short_timeframe, high)
`
This means:
- On a 5m chart with 30m/4h settings: Tracks 5m bar opens during 30m and 4h windows
- On a 1m chart with same settings: Tracks 1m bar opens during 30m and 4h windows
- Results will be different between chart timeframes
- May miss important price action that occurred between your chart's bars
Visual Elements
1. Level Lines
- Short TF High: Upper resistance line from shorter timeframe analysis
- Short TF Low: Lower support line from shorter timeframe analysis
- Long TF High: Broader resistance context from longer timeframe
- Long TF Low: Broader support context from longer timeframe
2. Zone Fills
- High Zone: Area between long TF high and short TF high (potential resistance cluster)
- Low Zone: Area between long TF low and short TF low (potential support cluster)
- Regular Fill: Standard transparency when levels are static
- Momentum Fill: Enhanced visibility when levels are actively changing
3. Dynamic Coloring
- Static Periods: Normal colors when levels haven't changed recently
- Active Periods: Momentum colors when levels are being tested/broken
- Confluence Zones: Different intensities based on timeframe alignment
Trading Applications
1. Support/Resistance Trading
- Entry Points: Trade bounces from zone boundaries
- Confluence Areas: Focus on areas where short and long TF levels cluster
- Zone Breaks: Enter on confirmed breaks through entire zones
- Multiple Timeframe Confirmation: Stronger signals when both timeframes align
2. Range Trading
- Zone Boundaries: Use fill zones as range extremes
- Mean Reversion: Trade back toward opposite zone when price reaches extremes
- Breakout Preparation: Watch for momentum color changes indicating potential breakouts
- Risk Management: Place stops outside the opposite zone
3. Trend Following
- Direction Bias: Trade in direction of zone breaks
- Pullback Entries: Enter on pullbacks to broken zones (now support/resistance)
- Momentum Confirmation: Use momentum coloring to confirm trend strength
- Multiple Timeframe Alignment: Strongest trends when both timeframes agree
4. Scalping Applications
- Quick Bounces: Trade rapid moves between zone boundaries
- Momentum Signals: Enter when momentum colors appear
- Short-Term Targets: Use opposite zone as profit target
- Tight Stops: Place stops just outside current zone
Optimization Guide
1. Timeframe Selection
For Different Trading Styles:
- Scalping: 15m/1h - Quick levels, frequent updates
- Day Trading: 30m/4h - Balanced view, good for intraday moves
- Swing Trading: 4h/1D - Longer-term perspective, fewer false signals
- Position Trading: 1D/1W - Major structural levels
2. Chart Timeframe Considerations
**Important**: Your chart timeframe affects results
- Lower Chart TF: More granular level tracking, but may be noisy
- Higher Chart TF: Smoother levels, but may miss important price action
- Recommended: Use chart timeframe 2-4x smaller than short indicator timeframe
3. Display Settings
- Busy Charts: Disable fills, show only key levels
- Clean Analysis: Enable all fills and momentum coloring
- Multi-Monitor Setup: Use different color schemes for easy identification
- Mobile Trading: Increase line width for visibility
Best Practices
1. Level Verification
- Always Cross-Check: Verify levels against actual higher timeframe charts
- Multiple Timeframes: Check 2-3 different chart timeframes for consistency
- Price Action Confirmation: Wait for candlestick confirmation at levels
- Volume Analysis: Combine with volume for stronger confirmation
2. Risk Management
- Stop Placement: Use zones rather than exact prices for stops
- Position Sizing: Reduce size when zones are narrow (higher risk)
- Multiple Targets: Scale out at different zone boundaries
- False Break Protection: Allow for minor zone penetrations
3. Signal Quality Assessment
- Momentum Colors: Higher probability when momentum coloring appears
- Zone Width: Wider zones often provide stronger support/resistance
- Historical Testing: Backtest on your preferred timeframe combinations
- Market Conditions: Adjust sensitivity based on volatility
Advanced Features
1. Momentum Detection System
The indicator tracks when levels change mid-period:
`pinescript
short_high_changed = short_high != short_high and not short_tf_start
`
This identifies:
- Active level testing
- Potential breakout situations
- Increased market volatility
- Trend acceleration points
2. Dynamic Color System
Complex conditional logic determines fill colors:
- Static Zones: Regular transparency for stable levels
- Active Zones: Enhanced colors for changing levels
- Mixed States: Different combinations based on user preferences
- Custom Overrides: User can prioritize certain color schemes
3. Zone Interaction Analysis
- Convergence: When short and long TF levels approach each other
- Divergence: When timeframes show conflicting levels
- Alignment: When both timeframes agree on direction
- Transition: When one timeframe changes while other remains static
Common Issues and Solutions
1. Inconsistent Levels
Problem: Levels look different on various chart timeframes
Solution: Always verify against actual higher timeframe charts
2. Missing Price Action
Problem: Important wicks or gaps not reflected in levels
Solution: Use chart timeframe closer to indicator's short timeframe setting
3. Too Many Signals
Problem: Excessive level changes and momentum alerts
Solution: Increase timeframe settings or reduce chart timeframe granularity
4. Lagging Signals
Problem: Levels seem to update too slowly
Solution: Decrease chart timeframe or use more sensitive timeframe combinations
Recommended Setups
Conservative Approach
- Timeframes: 4h/1D
- Chart: 1h
- Display: Show fills only, no momentum coloring
- Use: Swing trading, position management
Aggressive Approach
- Timeframes: 15m/1h
- Chart: 5m
- Display: All features enabled, momentum highlighting
- Use: Scalping, quick reversal trades
Balanced Approach
- Timeframes: 30m/4h
- Chart: 15m
- Display: Selective fills, momentum on key levels
- Use: Day trading, multi-session analysis
Final Notes
**Remember**: This indicator provides a synthetic view of multi-timeframe levels, not true higher timeframe data. While useful for identifying potential confluence areas, always verify important levels by checking actual higher timeframe charts.
**Best Results When**:
- Combined with actual multi-timeframe analysis
- Used for confluence confirmation rather than primary signals
- Applied with proper risk management
- Verified against price action and volume
**DISCLAIMER**: This indicator and its signals are intended solely for educational and informational purposes. The timeframe limitation means results may not reflect true higher timeframe levels. Always conduct your own analysis and verify levels independently before making trading decisions. Trading involves significant risk of loss.

Intraday Pivot Highs & Lows (Asia London NY)Intraday Pivot Highs & Lows (Asia London NY)
Script Description
This TradingView indicator is optimized for Forex, scalping, intraday, and day trading strategies. It accurately plots Pivot Points and levels, high/low, support and resistance levels. These are clearly identified to aid the trader during killzone sessions and session opens. Ideal for scalp trading, intraday sessions, and leveraging SMT (Smart Money Techniques). Utilize these Price Levels effectively during London Open, NY Open, and the Asia Session, utilizing Market Structure to pinpoint key levels and reversal zones for successful trading. Improve your Trade Setups, recognize reliable Chart Patterns, identify critical Price Pivots, and trade confidently off Institutional Levels.
This script marks the intraday pivot highs, lows and midpoints retracement levels for
Asia
London
New York
It also plots the previous day's high, low, midpoint, and 0.618 Fibonacci retracement levels, providing traders with critical price reference points for making intraday trading decisions.
Originality & Usefulness
This indicator uniquely integrates pivot calculations across three major Forex sessions (Asia, London, NY), clearly delineating session boundaries.
It enhances visibility by using distinct styling
solid for New York
dashed for London
dotted lines for Asia
And colour co-ordinated labeling, improving traders' ability to identify important intraday price action zones efficiently. Unlike standard pivot indicators, this script emphasizes session-specific trading dynamics.
### Key Features ###
Session-Based Levels: Automatically plots high, low, midpoint, and Fibonacci (.618) levels for each major session (Asia, London, NY).
Distinct Visual Cues: Lines and labels use session-specific styles and colors to easily differentiate between sessions.
Previous Day Reference: Clearly plots and labels yesterday's high, low, midpoint, and Fibonacci levels.
Flexible Visibility: Traders can set timeframe visibility to maintain clean charts on higher timeframes.
### How It Works
At the start of next day's session, previous session lines are cleared, ensuring the chart remains uncluttered.
High, low, midpoint, and Fibonacci retracement levels (.618) are dynamically calculated and displayed at the close of each session.
All session levels remain visible until the start of the next respective session, providing continuous actionable insights.
Trading Application:
Session highs and lows act as strong intraday support and resistance zones.
Midpoints and Fibonacci levels are effective for identifying potential reversal zones and retracements.
Daily levels provide a broader context, useful for gauging intraday volatility and range.
### Limitations and Considerations ##
Best used on liquid assets with clear session-based price action, such as Forex major pairs, if used on indexes make sure they contain 24 hour price action not just New York session.
This indicator is designed to streamline intraday trading by clearly marking essential pivot points and session-based levels, significantly improving traders' market context and decision-making accuracy. Can be used to enhance SMT decision making when scalping killzones.

Smart Trend Tracker Name: Smart Trend Tracker
Description:
The Smart Trend Tracker indicator is designed to analyze market cycles and identify key trend reversal points. It automatically marks support and resistance levels based on price dynamics, helping traders better navigate market structure.
Application:
Trend Analysis: The indicator helps determine when a trend may be nearing a reversal, which is useful for making entry or exit decisions.
Support and Resistance Levels: Automatically marks key levels, simplifying chart analysis.
Reversal Signals: Provides visual signals for potential reversal points, which can be used for counter-trend trading strategies.
How It Works:
Candlestick Sequence Analysis: The indicator tracks the number of consecutive candles in one direction (up or down). If the price continues to move N bars in a row in one direction, the system records this as an impulse phase.
Trend Exhaustion Detection: After a series of directional bars, the market may reach an overbought or oversold point. If the price continues to move in the same direction but with weakening momentum, the indicator records a possible trend slowdown.
Chart Display: The indicator marks potential reversal points with numbers or special markers. It can also display support and resistance levels based on key cycle points.
Settings:
Cycle Length: The number of bars after which the possibility of a reversal is assessed.
Trend Sensitivity: A parameter that adjusts sensitivity to trend movements.
Dynamic Levels: Setting for displaying key levels.
Название: Smart Trend Tracker
Описание:
Индикатор Smart Trend Tracker предназначен для анализа рыночных циклов и выявления ключевых точек разворота тренда. Он автоматически размечает уровни поддержки и сопротивления, основываясь на динамике цены, что помогает трейдерам лучше ориентироваться в структуре рынка.
Применение:
Анализ трендов: Индикатор помогает определить моменты, когда тренд может быть близок к развороту, что полезно для принятия решений о входе или выходе из позиции.
Определение уровней поддержки и сопротивления: Автоматически размечает ключевые уровни, что упрощает анализ графика.
Сигналы разворота: Индикатор предоставляет визуальные сигналы о возможных точках разворота, что может быть использовано для стратегий, основанных на контртрендовой торговле.
Как работает:
Анализ последовательности свечей: Индикатор отслеживает количество последовательных свечей в одном направлении (вверх или вниз). Если цена продолжает движение N баров подряд в одном направлении, система фиксирует это как импульсную фазу.
Выявление истощения тренда: После серии направленных баров рынок может достичь точки перегрева. Если цена продолжает двигаться в том же направлении, но с ослаблением импульса, индикатор фиксирует возможное замедление тренда.
Отображение на графике: Индикатор отмечает точки потенциального разворота номерами или специальными маркерами. Также возможен вывод уровней поддержки и сопротивления, основанных на ключевых точках цикла.
Настройки:
Длина цикла (Cycle Length): Количество баров, после которых оценивается возможность разворота.
Фильтрация тренда (Trend Sensitivity): Параметр, регулирующий чувствительность к трендовым движениям.
Уровни поддержки/сопротивления (Dynamic Levels): Настройка для отображения ключевых уровней.

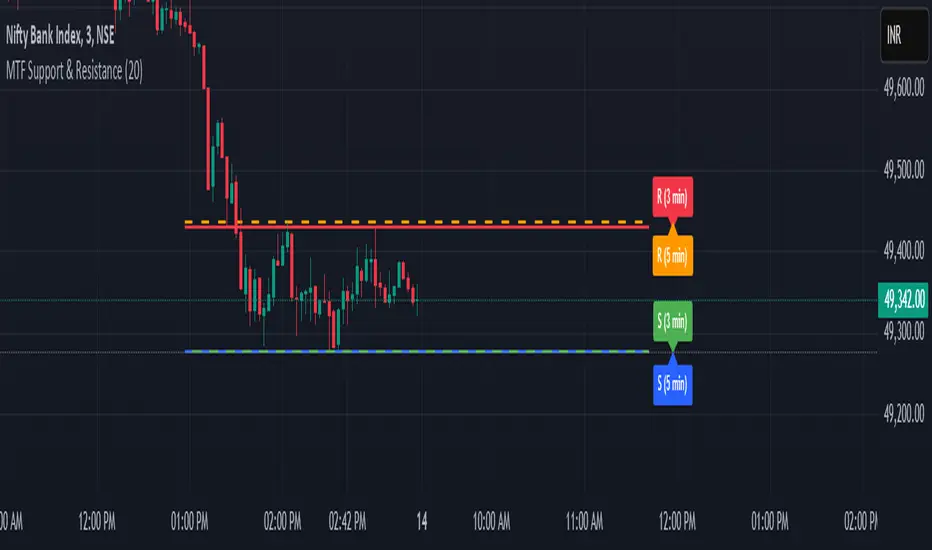
MTF Support & Resistance📌 Multi-Timeframe Support & Resistance (MTF S&R) Indicator
🔎 Overview:
The MTF Support & Resistance Indicator is a powerful tool designed to help traders identify critical price levels where the market is likely to react. This indicator automatically detects support and resistance zones based on a user-defined lookback period and extends these levels dynamically on the chart. Additionally, it provides multi-timeframe (MTF) support and resistance zones, allowing traders to view higher timeframe key levels alongside their current timeframe.
Support and resistance levels are crucial for traders as they help in determining potential reversal points, breakout zones, and trend continuation signals. By incorporating multi-timeframe analysis, this indicator enhances decision-making by providing a broader perspective of price action.
✨ Key Features & Benefits:
✅ Automatic Support & Resistance Detection – No need to manually plot levels; the indicator calculates them dynamically based on historical price action.
✅ Multi-Timeframe (MTF) Levels – Enables traders to see higher timeframe S&R levels on their current chart for better trend confirmation.
✅ Customizable Lookback Period – Adjust sensitivity by modifying the number of historical bars considered when calculating support and resistance.
✅ Color-Coded Visualization –
Green Line → Support on the current timeframe
Red Line → Resistance on the current timeframe
Dashed Blue Line → Higher timeframe support
Dashed Orange Line → Higher timeframe resistance
✅ Dynamic Extension of Levels – Levels extend left and right for better visibility across multiple bars.
✅ Real-Time Updates – Automatically refreshes as new price data comes in.
✅ Non-Repainting – Ensures reliable support and resistance levels that do not change after the bar closes.
📈 How to Use the Indicator:
Identify Key Price Levels:
The green line represents support, where price may bounce.
The red line represents resistance, where price may reject.
The blue dashed line represents support on a higher timeframe, making it a stronger level.
The orange dashed line represents higher timeframe resistance, helping identify major breakout zones.
Trend Trading:
Look for price action around these levels to confirm breakouts or reversals.
Combine with trend indicators (like moving averages) to validate trade entries.
Range Trading:
If the price is bouncing between support and resistance, consider range trading strategies (buying at support, selling at resistance).
Breakout Trading:
If the price breaks above resistance, it could indicate a bullish trend continuation.
If the price breaks below support, it could signal a bearish trend continuation.
⚙️ Indicator Settings:
Lookback Period: Determines the number of historical bars used to calculate support and resistance.
Show Higher Timeframe Levels (MTF): Enable/disable MTF support and resistance levels.
Extend Bars: Extends the drawn lines for better visualization.
Support/Resistance Colors: Allows users to customize the appearance of the lines.
⚠️ Important Notes:
This indicator does NOT generate buy/sell signals—it serves as a technical tool to improve trading analysis.
Best Used With Other Indicators: Consider combining it with volume, moving averages, RSI, or price action strategies for more reliable trade setups.
Works on Any Market & Timeframe: Forex, stocks, commodities, indices, and cryptocurrencies.
Use Higher Timeframe Levels for Stronger Confirmations: If a higher timeframe support/resistance level aligns with a lower timeframe level, it may indicate a stronger price reaction.
🎯 Who Should Use This Indicator?
📌 Scalpers & Day Traders – Identify short-term support and resistance levels for quick trades.
📌 Swing Traders – Utilize higher timeframe levels for position entries and exits.
📌 Trend Traders – Confirm breakout zones and key price levels for trend-following strategies.
📌 Reversal Traders – Spot potential reversal zones at significant S&R levels.
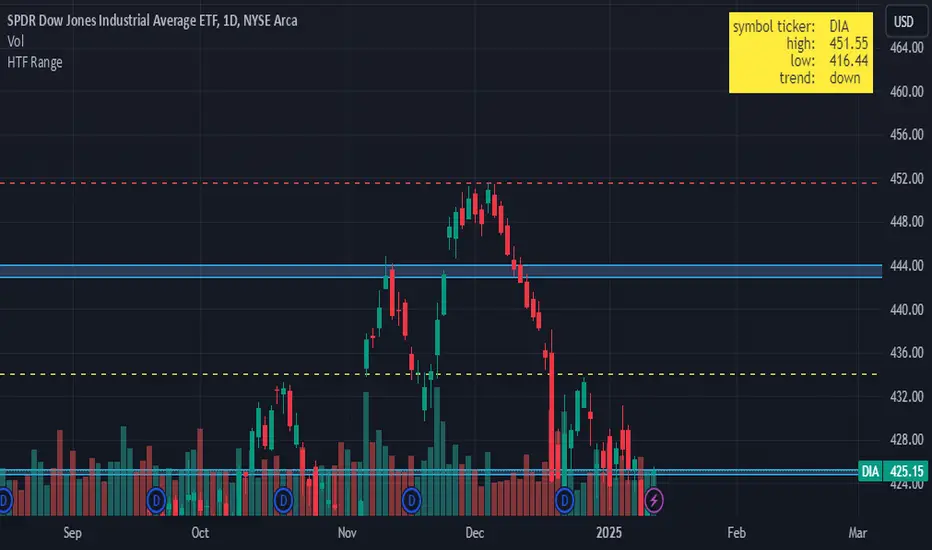
HTF RangeThis Pine Script indicator, HTF Range , is a tool designed to help traders visualize predefined ranges (highs and lows) and analyze price action within those levels. It's particularly useful for identifying key levels and trends for a set of pre-configured assets, such as cryptocurrencies, stocks, and forex pairs.
Key Features:
1. Predefined Symbol Ranges:
Stores a list of assets (tickers) with corresponding high, low, and trend information in an array.
Automatically matches the current symbol on the chart (syminfo.ticker) to fetch and display relevant range data:
High Range: The upper price level.
Low Range: The lower price level.
Trend: Indicates whether the trend is "up" or "down."
Example tickers: BTCUSDT, ETHUSDT, GBPUSD, NVDA, and more.
2. Range Visualizations:
Extremeties: Draws dashed horizontal lines for the high and low levels.
Half-Level: Marks the midpoint of the range with a dashed yellow line.
Upper and Lower Quarters: Highlights upper and lower portions of the range using shaded boxes with customizable extensions:
3. Configurable Inputs:
Enable/Disable Levels: Toggles for extremeties, half-levels, and quarter-levels.
Table Info: Option to display a table summarizing the range data (symbol, high, low, and trend).
4. Dynamic Calculations:
Automatically calculates the difference between the high and low (diff) for precise range subdivisions.
Dynamically adjusts visuals based on the trend (up or down) for better relevance to the market condition.
5. Table Display:
Provides a detailed summary of the asset's range and trend in the top-right corner of the chart:
Symbol ticker.
High and low levels.
Overall trend direction.
Use Case:
This indicator is ideal for traders who:
Trade multiple assets and want a quick overview of key price ranges.
Analyze price movements relative to predefined support and resistance zones.
Use range-based strategies for trend following, breakout trading, or reversals.
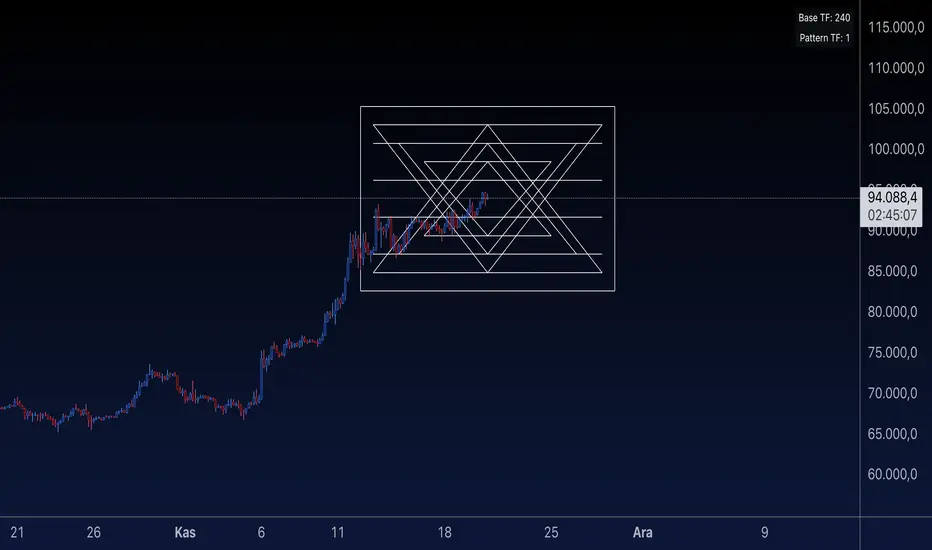
Sri Yantra MTF - AynetSri Yantra MTF - Aynet Script Overview
This Pine Script generates a Sri Yantra-inspired geometric pattern overlay on price charts. The pattern is dynamically updated based on multi-timeframe (MTF) inputs, utilizing high and low price ranges, and adjusting its size relative to a chosen multiplier.
The Sri Yantra is a sacred geometric figure used in various spiritual and mathematical contexts, symbolizing the interconnectedness of the universe. Here, it is applied to visualize structured price levels.
Scientific and Technical Explanation
Multi-Timeframe Integration:
Base Timeframe (baseRes): This is the primary timeframe for the analysis. The opening price and ATR (Average True Range) are calculated from this timeframe.
Pattern Timeframe (patternRes): Defines the granularity of the pattern. It ensures synchronization with price movements on specific time intervals.
Geometric Construction:
ATR-Based Scaling: The script uses ATR as a volatility measure to dynamically size the geometric pattern. The sizeMult input scales the pattern relative to price volatility.
Pattern Width (barOffset): Defines the horizontal extent of the pattern in terms of bars. This ensures the pattern is aligned with price movements and scales appropriately.
Sri Yantra-Like Geometry:
Outer Square: A bounding box is drawn around the price level.
Triangles: Multiple layers of triangles (primary, secondary, and tertiary) are calculated and drawn to mimic the structure of the Sri Yantra. These triangles converge and diverge based on price levels.
Horizontal Lines: Added at key levels to provide additional structure and aesthetic alignment.
Dynamic Updates:
The pattern recalculates and redraws itself on the last bar of the selected timeframe, ensuring it adapts to real-time price data.
A built-in check identifies new bars in the chosen timeframe (patternRes), ensuring accurate updates.
Information Table:
Displays the selected base and pattern timeframes in a table format on the top-right corner of the chart.
Allows traders to see the active settings for quick adjustments.
Key Inputs
Style Settings:
Pattern Color: Customize the color of the geometric patterns.
Size Multiplier (sizeMult): Adjusts the size of the pattern relative to price movements.
Line Width: Controls the thickness of the geometric lines.
Timeframe Settings:
Base Resolution (baseRes): Timeframe for calculating the pattern's anchor (default: daily).
Pattern Resolution (patternRes): Timeframe granularity for the pattern’s formation.
Geometric Adjustments:
Pattern Width (barOffset): Horizontal width in bars.
ATR Multiplier (rangeSize): Vertical size adjustment based on price volatility.
Scientific Concepts
Volatility Representation:
ATR (Average True Range): A standard measure of market volatility, representing the average range of price movements over a defined period. Here, ATR adjusts the vertical height of the geometric figures.
Geometric Symmetry:
The script emulates symmetry similar to the Sri Yantra, aligning with the principles of sacred geometry, which often appear in nature and mathematical constructs. Symmetry in financial data visualizations can aid in intuitive interpretation of price movements.
Multi-Timeframe Fusion:
Synchronizing patterns with multiple timeframes enhances the relevance of overlays for different trading strategies. For example, daily trends combined with hourly patterns can help traders optimize entries and exits.
Visual Features
Outer Square:
Drawn to encapsulate the geometric structure.
Represents the broader context of price levels.
Triangles:
Three layers of interlocking triangles create a fractal pattern, providing a visual alignment to price dynamics.
Horizontal Lines:
Emphasize critical levels within the pattern, offering visual cues for potential support or resistance areas.
Information Table:
Displays the active timeframe settings, helping traders quickly verify configurations.
Applications
Trend Visualization:
Patterns overlay on price movements provide a clearer view of trend direction and potential reversals.
Volatility Mapping:
ATR-based scaling ensures the pattern adjusts to varying market conditions, making it suitable for different asset classes and trading strategies.
Multi-Timeframe Analysis:
Integrates higher and lower timeframes, enabling traders to spot confluences between short-term and long-term price levels.
Potential Enhancements
Add Fibonacci Levels: Overlay Fibonacci retracements within the pattern for deeper price level insights.
Dynamic Alerts: Include alert conditions when price intersects key geometric lines.
Custom Labels: Add text descriptions for critical intersections or triangle centers.
This script is a unique blend of technical analysis and sacred geometry, providing traders with an innovative way to visualize market dynamics.
OA S/R PowerPurpose of the Script
This script identifies the strength of support and resistance levels based on key factors like volume, bounce frequency, and retests. Each level is assigned a score (0-100) and visualized with color-coded labels on the chart.
Key Features
Dynamic Strength Calculation:
Volume Strength: Measures the strength based on the volume of candles touching the level.
Bounce Strength: Evaluates how often the price bounces back from the level.
Retest Strength: Scores the consistency of retests over time.
Color-Coded Visualization:
Yellow: Strong levels (Strength ≥ 70).
Orange: Medium levels (Strength between 50-70).
Red: Resistance levels (Price is below the level).
Green: Support levels (Price is above the level).
Fully Customizable Settings:
Adjust the weight for volume, bounce, and retest contributions.
Configure timeframes, percentage range, and number of levels to analyze.
How It Works
Identify Peaks and Valleys: The script calculates local highs and lows using a configurable width setting to determine potential support and resistance levels.
Filter Key Levels: Nearby levels are merged based on a user-defined percentage range, ensuring clean and relevant levels.
Strength Scoring: Levels are scored dynamically based on:
The number of touches.
The volume of touches.
The frequency of bounces and retests.
Visual Feedback: Each level is plotted on the chart with a color-coded label, indicating its importance and price relationship.
Best Use Cases
Quickly identify strong support/resistance zones for breakout or reversal trades.
Use the dynamic scoring system to prioritize key levels for your strategy.
Customize weights to align with your trading style, such as emphasizing volume or retests.

Daily Manipulation and Distribution Levels with Buy/Sell SignalsIndicator Summary:
This indicator is designed for intraday traders, highlighting key price levels and providing simple buy/sell signals based on price manipulation and distribution concepts.
Key Features:
Core Levels:
Manipulation Plus/Minus: Derived from the daily open and a portion of the daily range (e.g., 25%).
Distribution Levels: Daily high and low serve as ultimate targets or resistance/support levels.
Buy and Sell Signals:
Buy Signal: Triggered when the price crosses above the Manipulation Plus level. A green "BUY" label marks the entry.
Sell Signal: Triggered when the price crosses below the Manipulation Minus level. A red "SELL" label marks the entry.
Clean Chart Design:
Hides unnecessary clutter, showing only relevant key levels and labeled signals for clarity.
How to Use:
Entry Points:
Buy Entry: When a green "BUY" label appears after the price breaks above the Manipulation Plus level.
Sell Entry: When a red "SELL" label appears after the price breaks below the Manipulation Minus level.
Exit Strategy:
Take Profit: Use the Distribution Levels (daily high/low) as take-profit zones.
Stop Loss: Set just above/below the Manipulation Levels to manage risk effectively.
One to Two Trades per Session: Focus on high-probability moves to ensure clarity and reduce overtrading.
Who It’s For:
This indicator is ideal for traders seeking a structured and visual approach to intraday trading, with clear entry/exit criteria based on price manipulation and distribution theory. It simplifies decision-making and ensures clean chart setups without overwhelming visuals.
PDL PWL [Dans]PDL PWL
Overview:
The PDL PWL indicator is a simple-designed for traders seeking to visualize key price levels derived from previous daily and weekly trading sessions. By incorporating significant price points such as Previous Day High (PDH), Previous Day Low (PDL), Previous Week High (PWH), and Previous Week Low (PWL), this indicator helps to make informed decisions based on historical price action.
Key Features:
Toggle Options:
Easily toggle the visibility of Previous Daily Levels and Previous Weekly Levels. This flexibility allows you to customize your chart according to your trading style and preferences.
Customizable Colors :
Personalize your chart by selecting colors for PDH, PDL, PWH, and PWL.
Equilibrium Levels:
The indicator calculates and displays equilibrium levels (EQ) for both daily and weekly levels.
Dynamic Updates:
The indicator automatically updates at 18:00 NY time, ensuring that you always have the latest previous high and low levels on your chart.
Daily Divider:
A daily divider line is drawn at the start of each trading day, helping you distinguish between trading sessions (daily) easily.
How to Use: Simply add the PDL PWL indicator to your chart, adjust the settings to fit your trading style, and observe how price interacts with the key levels.
Hope you will find this insightful !
Love,
Dans.

Precision Cloud by Dr ABIRAM SIVPRASAD
Precision Cloud by Dr. Abhiram Sivprasad"
The " Precision Cloud" script, created by Dr. Abhiram Sivprasad, is a multi-purpose technical analysis tool designed for Forex, Bitcoin, Commodities, Stocks, and Options trading. It focuses on identifying key levels of support and resistance, combined with moving averages (EMAs) and central pivot ranges (CPR), to help traders make informed trading decisions. The script also provides a visual "light system" to highlight potential long or short positions, aiding traders in entering trades with a clear strategy.
Key Features of the Script:
Central Pivot Range (CPR):
The CPR is calculated as the average of the high, low, and close of the price, while the top and bottom pivots are derived from it. These act as dynamic support and resistance zones.
The script can plot daily CPR, support, and resistance levels (S1/R1, S2/R2, S3/R3) as well as optional weekly and monthly pivot points.
The CPR helps identify whether the price is in a bullish, bearish, or neutral zone.
Support and Resistance Levels:
Three daily support (S1, S2, S3) and resistance (R1, R2, R3) levels are plotted based on the CPR.
These levels act as potential reversal or breakout points, allowing traders to make decisions around key price points.
EMA (Exponential Moving Averages):
The script includes two customizable EMAs (default periods of 9 and 21). You can choose the source for these EMAs (open, high, low, or close).
The crossovers between EMA1 and EMA2 help identify potential trend reversals or momentum shifts.
Lagging Span:
The Lagging Span is plotted with a customizable displacement (default 26), which helps identify overall trend direction by comparing past price with the current price.
Light System:
A color-coded table provides a visual representation of market conditions:
Green indicates bullish signals (e.g., price above CPR, EMAs aligning positively).
Red indicates bearish signals (e.g., price below CPR, EMAs aligning negatively).
Yellow indicates neutral conditions, where there is no clear trend direction.
The system includes lights for CPR, EMA, Long Position, and Short Position, helping traders quickly assess whether the market is in a buying or selling opportunity.
Trading Strategies Using the Script
1. Forex Trading:
Trend-Following with EMAs: Use the EMA crossovers to capture trending markets in Forex. A green light for the EMA combined with a price above the daily or weekly pivot levels suggests a buying opportunity. Conversely, if the EMA light turns red and price falls below the CPR levels, look for shorting opportunities.
Reversal Strategy: Watch for price action near the daily S1/R1 levels. If price holds above S1 and the EMA is green, this could signal a reversal from support. The same applies to resistance levels.
2. Bitcoin Trading:
Momentum Breakouts: Bitcoin is known for its sharp moves. The script helps to identify breakouts from the CPR range. If the price breaks above the TC (Top Central Pivot) with bullish EMA alignment (green light), it could signal a strong uptrend.
Lagging Span Confirmation: Use the Lagging Span to confirm the trend direction. For Bitcoin's volatility, when the lagging span shows consistent alignment with the price and CPR, it often indicates continuation of the trend.
3. Commodities Trading:
Support/Resistance Bounce: Commodities such as gold and oil often react well to pivot levels. Look for price bouncing off S1 or R1 for potential entry points. A green CPR light along with price above the pivot range supports a bullish bias.
EMA Pullback Strategy: If price moves in a strong trend and pulls back to one of the EMAs, a green EMA light suggests re-entry on a pullback. If the EMA light is red and price breaks below the BC (Bottom Central Pivot), short positions could be considered.
4. Stocks Trading:
Long Position Strategy: For stocks, use the combination of the long position light turning green (price above TC and EMA alignment) as a signal to buy. This could be especially useful for riding bullish trends in growth stocks or during earnings seasons when volatility is high.
Short Position Strategy: If the short position light turns green, indicating price below BC and EMAs turning bearish, this could be an ideal setup for shorting overvalued stocks or during market corrections.
5. Options Trading:
Directional Bias for Options: The light system is particularly helpful for options traders. A green long position light provides a clear signal to buy call options, while a green short position light supports buying puts.
Pivot Breakout Strategy: Buy options (calls or puts) when the price breaks above resistance or below support, with confirmation from the CPR and EMA lights. This helps capture the sharp moves required for profitable options trades.
Conclusion
The S&R Precision Cloud script is a versatile tool for traders across markets, including Forex, Bitcoin, Commodities, Stocks, and Options. It combines critical technical elements like pivot ranges, support and resistance levels, EMAs, and the Lagging Span to provide a clear picture of market conditions. The intuitive light system helps traders quickly assess whether to take a long or short position, making it an excellent tool for both new and experienced traders.
The S&R Precision Cloud by Dr. Abhiram Sivprasad script is a technical analysis tool designed to assist traders in making informed decisions. However, it should not be interpreted as financial or investment advice. The signals generated by the script are based on historical price data and technical indicators, which are inherently subject to market fluctuations and do not guarantee future performance.
Trading in Forex, Bitcoin, Commodities, Stocks, and Options carries a high level of risk and may not be suitable for all investors. You should be aware of the risks involved and be willing to accept them before engaging in such activities. Always conduct your own research and consult with a licensed financial advisor or professional before making any trading decisions.
The creators of this script are not responsible for any financial losses that may occur from its use. Past performance is not indicative of future results, and the use of this script is at your own risk.

Dynamic Support, Resistance & Fibo by RezaDynamic Support, Resistance & Fibonacci Levels by Reza
This Pine Script indicator dynamically calculates and plots significant support and resistance levels, along with key Fibonacci retracement levels, based on recent price action. It provides traders with essential tools to identify crucial levels on the chart that may influence future price movements.
Key Features:
Dynamic Support and Resistance Lines:
The script identifies recent swing highs and swing lows within a customizable lookback period to determine dynamic support and resistance levels.
These levels are plotted as horizontal lines (blue for support, red for resistance) and are updated in real-time to reflect changes in the price structure.
Labels next to each line display the exact price level of the support and resistance, making it easy to identify them at a glance.
Fibonacci Retracement Levels:
The script calculates and plots Fibonacci retracement levels (23.6%, 38.2%, 50.0%, 55.9%, 61.8%, 66.7%, and 78.6%) between the identified support and resistance levels.
These Fibonacci levels are plotted as dotted lines, with customizable colors and labels for clarity.
The Fibonacci levels provide traders with potential retracement and extension levels, which are commonly used to predict price reversals, pullbacks, and continuation zones.
Customization:
Users can adjust the lookback period for swing high and swing low calculations to suit different trading styles and market conditions.
The script allows traders to enable or disable Fibonacci levels and choose whether or not to remove the background color of the labels for cleaner chart visuals.
Line width, highlight colors, and label colors are fully customizable for better integration with various chart styles and themes.
Real-Time Dashboard:
The indicator includes a real-time dashboard that calculates and displays the next potential target based on current market conditions, including potential retracement or continuation targets.
The dashboard dynamically updates based on trend direction and Fibonacci zones, giving traders valuable insights into potential price objectives.
How to Use:
This indicator is suitable for multiple timeframes, helping traders identify key levels in real-time as the market evolves.
By providing support and resistance zones along with Fibonacci retracement levels, this script offers a powerful combination of technical analysis tools for both novice and experienced traders.
The dynamic calculations help traders spot potential areas for entering or exiting trades, placing stop-loss levels, and identifying profit-taking zones.
Ideal for:
Traders who want to use support and resistance levels for trade planning.
Fibonacci enthusiasts looking for automated level plotting.
Anyone seeking to identify key price levels in real-time across different timeframes.
Script Author:
Reza – Bringing you dynamic, real-time support, resistance, and Fibonacci level plotting for more effective trading decisions.
Market Indicator by Atilla YurtsevenThis TradingView script is designed to analyze and visualize market trends by showing the percentage drops from the all-time high (ATH) of a stock or any other financial instrument. It also calculates and displays key statistical levels such as the mean, median, and various percentage thresholds. This indicator helps traders identify significant retracement levels and possible support/resistance zones based on historical price movements.
Indicator Settings:
- The indicator is named "Market // Atilla Yurtseven" and can be overlaid on the price chart.
- Users can choose to use the closing price (Use Close Price) or the high/low prices.
- Options are provided to show the ATH, ATL (All-Time Low), mean, median, and various minor and macro percentage levels.
Color Customization:
- The script allows customization of text and line colors for different levels, making it adaptable to different charting styles.
Initial Variable Setup:
- The script initializes several variables, including ATH, ATL, and arrays to store price data.
The round and roundy functions are used to format the values for display purposes.
ATH/ATL Calculation:
- The script checks if the current price exceeds the previous ATH and updates the ATH accordingly.
- Similarly, the script calculates the ATL based on the lowest point after reaching the ATH.
Mean and Median Calculation:
- The mean is calculated as the average drop from the ATH, while the median is the middle value in the sorted array of drops.
- These statistics provide insight into the overall trend and are used to identify significant price levels.
Plotting the Levels:
The script plots the ATH, ATL, mean, median, and various percentage retracement levels (12.5%, 25%, 37.5%, etc.).
The levels are color-coded based on user preferences, making it easier to interpret the chart visually.
Labels and Text Display:
- The script dynamically creates and updates labels on the chart to show the values of the ATH, ATL, mean, median, and other key levels.
- This feature allows traders to see at a glance how far the current price is from these critical levels.
Hit Detection:
- The script includes logic to detect if the price is within the range of the mean and median. If the price is within this range, the color of the fill between these levels changes, highlighting this area on the chart.
This script is a powerful tool for traders who want to analyze the retracement levels from historical highs. By displaying the mean, median, and various percentage levels, it provides a comprehensive view of potential support and resistance areas, helping traders make more informed decisions. The customizable nature of the script allows it to fit seamlessly into different trading strategies and charting styles.
Disclaimer:
This script is provided for informational and educational purposes only and does not constitute financial or investment advice. The author, Atilla Yurtseven, is not responsible for any financial losses or damages that may occur as a result of using this script. Trading and investing in financial markets involve risk, and past performance is not indicative of future results. Users should conduct their own research and consult with a qualified financial advisor before making any investment decisions. Use this script at your own risk.
Trade smart, stay safe.
Atilla Yurtseven

Volume Spread Analysis [TANHEF]Volume Spread Analysis: Understanding Market Intentions through the Interpretation of Volume and Price Movements.
█ Simple Explanation:
The Volume Spread Analysis (VSA) indicator is a comprehensive tool that helps traders identify key market patterns and trends based on volume and spread data. This indicator highlights significant VSA patterns and provides insights into market behavior through color-coded volume/spread bars and identification of bars indicating strength, weakness, and neutrality between buyers and sellers. It also includes powerful volume and spread forecasting capabilities.
█ Laws of Volume Spread Analysis (VSA):
The origin of VSA begins with Richard Wyckoff, a pivotal figure in its development. Wyckoff made significant contributions to trading theory, including the formulation of three basic laws:
The Law of Supply and Demand: This fundamental law states that supply and demand balance each other over time. High demand and low supply lead to rising prices until demand falls to a level where supply can meet it. Conversely, low demand and high supply cause prices to fall until demand increases enough to absorb the excess supply.
The Law of Cause and Effect: This law assumes that a 'cause' will result in an 'effect' proportional to the 'cause'. A strong 'cause' will lead to a strong trend (effect), while a weak 'cause' will lead to a weak trend.
The Law of Effort vs. Result: This law asserts that the result should reflect the effort exerted. In trading terms, a large volume should result in a significant price move (spread). If the spread is small, the volume should also be small. Any deviation from this pattern is considered an anomaly.
█ Volume and Spread Analysis Bars:
Display: Volume and/or spread bars that consist of color coded levels. If both of these are displayed, the number of spread bars can be limited for visual appeal and understanding, with the spread bars scaled to match the volume bars. While automatic calculation of the number of visual bars for auto scaling is possible, it is avoided to prevent the indicator from reloading whenever the number of visual price bars on the chart is adjusted, ensuring uninterrupted analysis. A displayable table (Legend) of bar colors and levels can give context and clarify to each volume/spread bar.
Calculation: Levels are calculated using multipliers applied to moving averages to represent key levels based on historical data: low, normal, high, ultra. This method smooths out short-term fluctuations and focuses on longer-term trends.
Low Level: Indicates reduced volatility and market interest.
Normal Level: Reflects typical market activity and volatility.
High Level: Indicates increased activity and volatility.
Ultra Level: Identifies extreme levels of activity and volatility.
This illustrates the appearance of Volume and Spread bars when scaled and plotted together:
█ Forecasting Capabilities:
Display: Forecasted volume and spread levels using predictive models.
Calculation: Volume and Spread prediction calculations differ as volume is linear and spread is non-linear.
Volume Forecast (Linear Forecasting): Predicts future volume based on current volume rate and bar time till close.
Spread Forecast (Non-Linear Dynamic Forecasting): Predicts future spread using a dynamic multiplier, less near midpoint (consolidation) and more near low or high (trending), reflecting non-linear expansion.
Moving Averages: In forecasting, moving averages utilize forecasted levels instead of actual levels to ensure the correct level is forecasted (low, normal, high, or ultra).
The following compares forecasted volume with actual resulting volume, highlighting the power of early identifying increased volume through forecasted levels:
█ VSA Patterns:
Criteria and descriptions for each VSA pattern are available as tooltips beside them within the indicator’s settings. These tooltips provide explanations of potential developments based on the volume and spread data.
Signs of Strength (🟢): Patterns indicating strong buying pressure and potential market upturns.
Down Thrust
Selling Climax
No Effort → Bearish Result
Bearish Effort → No Result
Inverse Down Thrust
Failed Selling Climax
Bull Outside Reversal
End of Falling Market (Bag Holder)
Pseudo Down Thrust
No Supply
Signs of Weakness (🔴): Patterns indicating strong selling pressure and potential market downturns.
Up Thrust
Buying Climax
No Effort → Bullish Result
Bullish Effort → No Result
Inverse Up Thrust
Failed Buying Climax
Bear Outside Reversal
End of Rising Market (Bag Seller)
Pseudo Up Thrust
No Demand
Neutral Patterns (🔵): Patterns indicating market indecision and potential for continuation or reversal.
Quiet Doji
Balanced Doji
Strong Doji
Quiet Spinning Top
Balanced Spinning Top
Strong Spinning Top
Quiet High Wave
Balanced High Wave
Strong High Wave
Consolidation
Bar Patterns (🟡): Common candlestick patterns that offer insights into market sentiment. These are required in some VSA patterns and can also be displayed independently.
Bull Pin Bar
Bear Pin Bar
Doji
Spinning Top
High Wave
Consolidation
This demonstrates the acronym and descriptive options for displaying bar patterns, with the ability to hover over text to reveal the descriptive text along with what type of pattern:
█ Alerts:
VSA Pattern Alerts: Notifications for identified VSA patterns at bar close.
Volume and Spread Alerts: Alerts for confirmed and forecasted volume/spread levels (Low, High, Ultra).
Forecasted Volume and Spread Alerts: Alerts for forecasted volume/spread levels (High, Ultra) include a minimum percent time elapsed input to reduce false early signals by ensuring sufficient bar time has passed.
█ Inputs and Settings:
Display Volume and/or Spread: Choose between displaying volume bars, spread bars, or both with different lookback periods.
Indicator Bar Color: Select color schemes for bars (Normal, Detail, Levels).
Indicator Moving Average Color: Select schemes for bars (Fill, Lines, None).
Price Bar Colors: Options to color price bars based on VSA patterns and volume levels.
Legend: Display a table of bar colors and levels for context and clarity of volume/spread bars.
Forecast: Configure forecast display and prediction details for volume and spread.
Average Multipliers: Define multipliers for different levels (Low, High, Ultra) to refine the analysis.
Moving Average: Set volume and spread moving average settings.
VSA: Select the VSA patterns to be calculated and displayed (Strength, Weakness, Neutral).
Bar Patterns: Criteria for bar patterns used in VSA (Doji, Bull Pin Bar, Bear Pin Bar, Spinning Top, Consolidation, High Wave).
Colors: Set exact colors used for indicator bars, indicator moving averages, and price bars.
More Display Options: Specify how VSA pattern text is displayed (Acronym, Descriptive), positioning, and sizes.
Alerts: Configure alerts for VSA patterns, volume, and spread levels, including forecasted levels.
█ Usage:
The Volume Spread Analysis indicator is a helpful tool for leveraging volume spread analysis to make informed trading decisions. It offers comprehensive visual and textual cues on the chart, making it easier to identify market conditions, potential reversals, and continuations. Whether analyzing historical data or forecasting future trends, this indicator provides insights into the underlying factors driving market movements.

Dual Session Range Boxes with FIB Lines█ OVERVIEW
The Dual Session Range Boxes with FIB Lines indicator is a powerful tool for identifying and visualizing Range Breakout or Inside Boxes Strategy setups with dual session tracking, customizable Fibonacci extensions, and trade zone levels. Perfect for traders who focus on session-based strategies across multiple markets.
█ FEATURES
◆ DUAL SESSION RANGES
- Range 1: Defines the Range (ORB) based on a specific time window
- Range 2: Extends the Range levels throughout a second session for trade management
- Both ranges can be independently configured with preset sessions or custom times
◆ SESSION PRESETS
- Tokyo Session (00:00 - 09:00)
- London Session (08:00 - 17:00)
- New York Session (14:00 - 21:00)
- Pre Market Session (10:00 - 15:30)
- Custom Time: Define your own session windows
◆ FIBONACCI EXTENSION LEVELS
- Automatically calculated from Range 1 High/Low
- Buy Side Levels: Projected above the range (green)
- Sell Side Levels: Projected below the range (red)
- 10 customizable Fib levels with individual on/off toggles:
- 23.6%, 38.2%, 50%, 61.8%, 78.6%, 100%, 127.2%, 161.8%, 200%, 261.8%
- Special color highlighting for key levels (50%, 100%, 200%)
- All percentage values are fully editable
◆ INSIDE TRADE ZONES
- Two horizontal lines drawn inside the Range 1 box
- Configurable percentage from High/Low (default: 10%)
- Helps identify premium/discount zones within the range
◆ LABELS & DISPLAY OPTIONS
- Show/hide price values on labels
- Show/hide percentage values on labels
- Adjustable label size (Tiny, Small, Normal, Large, Huge)
- Configurable label offset (distance above lines)
- Multiple rounding options for price display:
- 0.25 (quarter points - ideal for indices)
- 0.1 (tenth points)
- 0.01 (two decimals)
◆ STYLE CUSTOMIZATION
- Independent fill and border colors for both ranges
- Adjustable border width (1-5)
- Line style options: Solid, Dashed, Dotted
- Separate color settings for:
- Buy side Fibonacci levels
- Sell side Fibonacci levels
- Trade zone lines
- Special levels (50%, 100%, 200%)
◆ HISTORICAL DATA CONTROL
- Toggle to show/hide historical sessions
- Current session always remains visible
- Clean chart view when analyzing only the active session
█ HOW TO USE
1. Set your timezone in General settings
2. Configure Range 1 to capture your desired Opening Range period
3. Configure Range 2 to define how long levels should extend
4. Adjust Fibonacci levels based on your trading strategy
5. Use Trade Zones to identify key areas within the range
6. Toggle historical data on/off based on your analysis needs
█ USE CASES
- Opening Range Breakout (ORB) strategies
- Session-based trading (London, New York, Tokyo, Pre-Market)
- Fibonacci extension targets for breakout trades
- Identifying support/resistance from session ranges
- Multi-session analysis and confluence zones
█ NOTES
- Indicator works on timeframes lower than Daily
- All times are based on the selected timezone setting
- Range 2 only activates after Range 1 completes
- Fibonacci levels extend from Range 1 start to Range 2 end
Let me know if you like to have any enhancements.
Leave a like if you like it!

cd_sfp_CxGeneral:
This indicator is designed to assist users who trade the Swing Failure Pattern ( SFP ).
In technical literature (various definitions exist), an SFP is a situation where the price violates a previous swing level but fails to close beyond that level.
• (Liquidity Sweep)
• (Buyer or seller dominance)
• (Stop hunt)
• (Turtle Soup)
The general strategy is built upon seeking trade opportunities after an SFP is formed and conviction is established that the market direction has changed.
Components used to gather confirmation:
• Determining Bias: Periodic SAR
• Obtaining Breakout/Reversal Confirmation: Change in State Delivery (CISD)
• Defining the Buyer/Seller Block (Supply/Demand Zones): Mitg Blocks (Mitigation Blocks), FVG (Fair Value Gaps), and Standard Deviation Projection
• Key Levels: Previous HTF (Higher Time Frame) levels
• Setting Targets: Standard Deviation Projection
• Trade Management: Anchored VWAP and opposing blocks
• Time-Based Context: Session Killzone times
• Notifications: An alarm/alert system will be utilized to stay informed.
________________________________________
Details:
Swing and Swing Failure Pattern:
Swing Sweep Types (Liquidity Sweep):
1. Single
2. Consecutive (The liquidity of the entity that swept the liquidity is being swept)
Bias Determination
We need to filter out the numerous SFPs that occur across all time frames. Our first strong filter will be the Bias. We will only look for trades aligned with our bias.
We will use Periodic SAR (Stop and Reverse) to determine the bias. We compare the price with the SAR value from a Higher Time Frame than the one we are trading on.
• Price > SAR => Bullish Bias
• Price < SAR => Bearish Bias
Depending on the pair, H1 SAR may be chosen for scalp trades, and Daily/Weekly SAR for intraday and swing trades.
Key Levels
Strategies looking for trades after a liquidity grab generally state that the sweep / stop hunt movement should occur at a significant price level.
The most fundamental Key Level levels are (User can customize):
• Previous Week High & Low
• Previous Day High & Low
• Previous H4 High & Low
• Previous H1 High & Low
• Asia Killzone High & Low
• London Killzone High & Low
• New York Killzone High & Low
• Monday Range High & Low values
We will prefer SFP formations that occur when these levels are swept. When Key Levels are violated, an information label appears on the screen.
Blocks / Zones
To strengthen our hand, we will use three types of blocks/zones, either with Key Levels or separately. When an SFP structure is formed in these areas (along with bias and breakout confirmation), our expectation is for the price to continue in our desired direction. These regions are:
1. Mitigation Blocks (Mtg)
o (Details can be found in the cd_VWAP_mtg_Cx indicator)
o In short: A second candle, following a bullish candle, crosses its high but fails to close above it. We call this a sweep / SFP. When the price, which was expected to go to the low, instead makes a new high/close, an Mtg block is formed. (Buyers are dominant)
2. FVGs (Fair Value Gaps)
o We use classic FVG structures.
3. Standard Deviation Projection Boxes
o When we get an SFP structure + breakout confirmation (CISD), we use the Standard Deviation Projection to determine our profit-taking and take-profit levels.
o Based on the idea that the price often respects the range between -2 and -2.5 of the projection values, we box this range and use it as our area of interest. (Our expectation is for the price to reverse after reaching this target).
o Let's mark it on the chart.
Confirmation
To summarize what has been explained so far: we look for the price to form an SFP structure in levels/zones we deem important, aligned with our bias, and for the breakout to be confirmed with a CISD.
No single component is strong on its own, but the success rate increases when they occur together.
We observe the following as additional confirmation along with the CISD: a new Mtg block forming in the direction of the breakout, high-volume movement (with FVG and a large body), and respect for VWAPs, the resistance/support line, and the defense block.
Additional Confirmations with Breakouts:
• Defence block, new mtg and VWAP
• Resistance / Support Line:
Indicator Signals
The indicator marks all formed sweeps, selected key levels, blocks, the projection, and CISD confirmations on the screen. The candle where the CISD confirmation occurs is indicated by an arrow.
• Arrows with double short lines signify a CISD that follows an SFP occurring at a Key Level.
• All other CISD candle indications are shown with single-line arrows.
Trade Management
When selecting profit targets in trades (preferably), the projection, opposing blocks, and structures that have formed are taken into account. Do not neglect to look at the structures that have formed against you when entering a trade.
Menu Settings:
• For Mtg blocks, the trading timeframe or a higher timeframe can be selected.
• FVGs formed in the current timeframe are displayed when the price creates an SFP (in "Fvg" option).
• Deviation boxes are displayed when the price creates an SFP (in box).
• The SAR HTF setting (H1) for scalp trades may vary depending on the pair. Users trying trades on higher timeframes should increase the HTF setting.
o Example: If you are looking for a trade with an SFP structure on H1, the SAR HTF setting should be H4 or higher.
• VWAP lines are refreshed starting from the candle that executed the sweep when the price forms an SFP. The only setting to adjust is the source selection setting (hlc3 is selected).
• Time frames and Killzone / Special Zone settings for Key Levels can be changed/should be checked.
Alarms / Alerts:
The conditions that will trigger an alert can be selected from the menu.
• To receive an alert aligned with the bias, the "Alignment with bias" checkbox must be selected.
• The alert should be set on the timeframe where you plan to enter the trade.
• The display options do not affect the alarm conditions. (Example: FVGs are monitored even when the menu selection is "off").
• If the necessary conditions are met, the alarm is triggered on the new candle that opens after the CISD confirmation.
• The alarm will not be triggered more than once at the same Key Level.
The user can preferably select alerts:
• Bias-aligned or Bias-independent
• Sweep (without waiting for CISD)
• Sweep + CISD (without looking for other conditions)
• Sweep + Key Level + CISD (the swept level is a Key Level)
• Sweep + Mtg / Fvg / Dev. + CISD (SFP formed in any of the blocks)
• Sweep + Mtg + CISD (SFP formed in the Mtg block)
• Sweep + Fvg + CISD (SFP formed inside the FVG)
• Sweep + Deviation Box + CISD (SFP formed inside the Dev. Box)
• Sweep + Key Level + Mtg / Fvg / Dev. + CISD (SFP formed simultaneously at a Key Level and any of the blocks)
Trade Example:
• Conditions: Bias-aligned + Sweep + Mtg/Fvg/Dev (at least one) + CISD
• Extra Confirmations: Respect for the Defense Block + Respect for VWAP
• Target (TP): Projection between -2 and -2.5
I welcome your thoughts and suggestions regarding my indicator, which I believe will be successful in the long run by adhering to uncompromising risk management and a strict trading plan.
Happy Trading!

Fractal Circles#### FRACTAL CIRCLES ####
I combined 2 of my best indicators Fractal Waves (Simplified) and Circles.
Combining the Fractal and Gann levels makes for a very simple trading strategy.
Core Functionality
Gann Circle Levels: This indicator plots mathematical support and resistance levels based on Gann theory, including 360/2, 360/3, and doubly strong levels. The system automatically adjusts to any price range using an intelligent multiplier system, making it suitable for forex, stocks, crypto, or any market.
Fractal Wave Analysis: Integrates real-time trend analysis from both current and higher timeframes. Shows the current price range boundaries (high/low) and trend direction through dynamic lines and background fills, helping traders understand market structure.
Key Trading Benefits
Active Level Detection: The closest Gann level to current price is automatically highlighted in green with increased line thickness. This eliminates guesswork about which level is most likely to act as immediate support or resistance.
Real-Time Price Tracking: A customizable line follows current price with an offset to the right, projecting where price sits relative to upcoming levels. A gradient-filled box visualizes the exact distance between current price and the active Gann level.
Multi-Timeframe Context: View fractal waves from higher timeframes while maintaining current timeframe precision. This helps identify whether short-term moves align with or contradict longer-term structure.
Smart Alert System: Comprehensive alerts trigger when price crosses any Gann level, with options to monitor all levels or focus only on the active level. Reduces the need for constant chart monitoring while ensuring you never miss significant level breaks.
Practical Trading Applications
Entry Timing: Use active level highlighting to identify the most probable support/resistance for entries. The real-time distance box helps gauge risk/reward before entering positions.
Risk Management: Set stops based on Gann level breaks, particularly doubly strong levels which tend to be more significant. The gradient visualization makes it easy to see how much room price has before hitting key levels.
Trend Confirmation: Fractal waves provide immediate context about whether current price action aligns with broader market structure. Bullish/bearish background fills offer quick visual confirmation of trend direction.
Multi-Asset Analysis: The auto-scaling multiplier system works across all markets and timeframes, making it valuable for traders who monitor multiple instruments with vastly different price ranges.
Confluence Trading: Combine Gann levels with fractal wave boundaries to identify high-probability setups where multiple technical factors align.
This tool is particularly valuable for traders who appreciate mathematical precision in their technical analysis while maintaining the flexibility to adapt to real-time market conditions.
Contrarian with 5 Levels5 Levels application was inspired and adapted from Predictive Ranges indicator developed by Lux Algo. So much credit to their work.
Indicator Description: Contrarian with 5 Levels
Overview
The "Contrarian with 5 Levels" indicator is a powerful tool designed for traders seeking to identify potential reversal points in the market by combining contrarian trading principles with dynamic support and resistance levels. This indicator overlays a Simple Moving Average (SMA) shadow and five adaptive price levels, integrating Institutional Concepts of Structure (ICT) such as Break of Structure (BOS) and Market Structure Shift (MSS) to provide clear buy and sell signals. It is ideal for traders looking to capitalize on overextended price movements, particularly on the daily timeframe, though it is adaptable to other timeframes with proper testing.
How It Works
The indicator operates on two core components:
Contrarian SMA Shadow: A shaded region between the SMA of highs and lows (default length: 100) acts as a dynamic zone to identify overbought or oversold conditions. When the price moves significantly outside this shadow, it signals potential exhaustion, aligning with contrarian trading principles.
Five Adaptive Levels: Using a modified ATR-based calculation, the indicator plots five key levels (two resistance, one average, and two support) that adjust dynamically to market volatility. These levels serve as critical zones for potential reversals.
ICT Structure Analysis: The indicator incorporates BOS and MSS logic to detect shifts in market structure, plotting bullish and bearish breaks with customizable colors for clarity.
Buy and sell signals are generated when the price crosses key levels while outside the SMA shadow, indicating potential reversal opportunities. The signals are visualized as small circles above (sell) or below (buy) the price bars, making them easy to interpret.
Mathematical Concepts
SMA Shadow: The indicator calculates the SMA of the highest highs and lowest lows over a user-defined period (default: 100). This creates a dynamic range that highlights extreme price movements, which contrarian traders often target for reversals.
Five Levels Calculation: The five levels are derived using a volatility-adjusted formula based on the Average True Range (ATR). The average level (central pivot) is calculated as a smoothed price, with two upper (resistance) and two lower (support) levels offset by a multiple of the ATR (default multiplier: 6.0). This adaptive approach ensures the levels remain relevant across varying market conditions.
ICT BOS/MSS Logic: The indicator identifies pivot highs and lows on a user-defined timeframe (default: daily) to detect structural breaks. A BOS occurs when the price breaks a prior pivot high (bullish) or low (bearish), while an MSS signals a shift in market direction, providing context for potential reversals.
Entry and Exit Rules
Buy Signal (Blue Dot Below Bar): Triggered when the closing price is below both the SMA shadow (smaLow) and the average level (avg), and the price crosses under either the first or second support level (prS1 or prS2). This suggests the market may be oversold, indicating a potential reversal upward.
Sell Signal (White Dot Above Bar): Triggered when the closing price is above both the SMA shadow (smaHigh) and the average level (avg), and the price crosses over either the first or second resistance level (prR1 or prR2). This suggests the market may be overbought, indicating a potential reversal downward.
Recommended Usage
This indicator is optimized for the daily timeframe, where it has been designed to capture significant reversal opportunities in trending or ranging markets. However, it can be adapted to other timeframes (e.g., 1H, 4H, 15M) with proper testing of settings such as SMA length, ATR multiplier, and structure timeframe. Users are encouraged to backtest and optimize parameters to suit their trading style and asset class.
Customization Options
SMA Length: Adjust the SMA period (default: 100) to control the sensitivity of the shadow.
Five Levels Length and Multiplier: Modify the length (default: 200) and ATR multiplier (default: 6.0) to fine-tune the support/resistance levels.
Timeframe Settings: Set separate timeframes for structure analysis and five levels to align with your trading strategy.
Color and Signal Display: Customize colors for BOS/MSS lines and toggle buy/sell signals on or off for a cleaner chart.
Why Use This Indicator?
The "Contrarian with 5 Levels" indicator combines the power of contrarian trading with dynamic levels and market structure analysis, offering a unique perspective for identifying high-probability reversal setups. Its intuitive design, customizable settings, and clear signal visualization make it suitable for both novice and experienced traders. Whether you're trading forex, stocks, or cryptocurrencies, this indicator provides a robust framework for spotting potential turning points in the market.
We hope you find the "Contrarian with 5 Levels" indicator a valuable addition to your trading toolkit! Happy trading!
Please leave feedback in the comments section.

cd_respect2_EQ_Cx🔹 Overview:
Many traders form a bias or look for trade setups by analyzing the high (H) and low (L) of previous higher timeframe candles. For example: a close above the previous daily high, a failure to close after breaking the high, or approaching the level without making a new high. As we’ve been taught to focus on these key levels, I wanted to draw attention to what's happening at the mid-levels (Equilibrium) of the current and higher timeframe candles.
We’ve all heard the phrase “Strong price reacts from equilibrium,” yet most of us wait at the extremes.
While working on equilibrium levels of both higher timeframes and the current timeframe, I noticed that when a current candle closes above/below the previous HTF candle's high/low, price often respects the part of the candle that caused the break — which I refer to as the Last Block. When respected, price tends to continue with momentum; when lost, a pullback or reversal often follows.
________________________________________
🔹 About the Indicator:
This tool analyzes four different higher timeframes and shows:
• Current candle equilibrium levels
• Previous candle equilibrium levels (2 display options):
1. On Box – classic display
2. On Candle – equilibrium is linked to the last candle that includes the level, making those candles more meaningful or "strengthened"
• Alerts (standard) and on-screen warnings when price approaches previous equilibrium levels
• High/Low levels of previous HTF candles
• High/Low levels of live HTF candles
• Last Block: the upper or lower part of the candle that caused the breakout when price closes above/below the previous HTF high/low
• Countdown timer until the close of selected HTFs
________________________________________
🔹 Menus & Usage:
🔸 Show/Hide Tab:
• Toggle Previous Equilibrium display (On Candle / On Box)
• Toggle Live Equilibrium levels, color selection, and left extension
• Toggle Current Candle Equilibrium and colors
• Alert on Chart: flashing on-screen visual alert
• Approach Limit: sets how close price must be to trigger alert
• Remaining Time (RT): toggle countdown display for selected timeframes
________________________________________
🔸 HTF H/L Levels Tab:
• Show previous and live HTF candle highs/lows
• Customize colors, starting points, and left extension options
________________________________________
🔸 Timeframes & Options Tab:
• Select which timeframes to display
• Choose level colors
• Enable price alerts
• Control visibility in the time chart
• Toggle Last Block display (close-to-high/low)
________________________________________
🔸 Look Back HTF Candles Tab:
• Delete filled levels: removes invalidated zones; only unmitigated remain
• Back Control: set how many candles to look back per timeframe (unlimited if not set)
________________________________________
🔸 HTF Boxes Tab:
• Display HTF candles in boxes
• Set colors (single color or per timeframe)
• Adjust font sizes across the chart
________________________________________
🔹 Usage & Last Blocks:
The core idea behind both equilibrium levels and last blocks is:
Price should “gain” and respect them to validate continuation.
Viewing multiple timeframes together strengthens bias.
Each level is treated as part of the candle it's associated with — defining the “area to be gained.”
“Did price respect the level because of that candle, or did the candle gain significance because it aligned with the level? That’s open for debate.”
(In my opinion, the candle gains significance because it aligns with the level.)
When respected, these levels/blocks act as support; when lost, they act as resistance.
In suitable timeframes, reclaiming previous equilibrium levels may be interpreted as CHoCH / CISD / IDM depending on the context.
________________________________________
🔹 Usage Example – Last Blocks:
I personally trade on 1-minute and use Daily / H4 / H1 / 15m as selected timeframes.
For example, if price reclaims the previous 15m level, I view it as a Change of Character. I then expect the next candle to show respect in that direction.
Choose timeframes based on your trading style.
Sometimes, HTF levels (past and live) cluster tightly — these areas are key watch zones for me.
That’s the reason I decided to share this indicator.
________________________________________
🔹 Chart Examples:
🔸 Example 1:
Price closes above both the 12:45 15m candle and the 12:00 H1 equilibrium levels.
Last Block forms. After retracing, price mitigates the block and respects live equilibrium levels (H4/H1/15m).
🔸 Example 2:
Explained on chart – Levels that pushed price down in the bearish trend later acted as support.
🔸 Example 3 – CHoCH/CISD/IDM Alternative:
Explained on chart – Replacing structural signals with equilibrium levels.
I see this pattern often — very effective.
🔸 Example 4:
Many levels are clustered in a narrow range; price shows respect across the board.
________________________________________
🔹 Final Note:
Hope you like the tool. I’d love to hear your thoughts and suggestions.
"Keep in mind, strong price reverses from equilibrium."
Happy trading!